RSI
RSI (Relative Strength Index) is a popular technical analysis indicator that helps evaluate the strength of the current trend and the probability of a reversal.
It is simple to use and therefore widely used by traders.
Main Features
- Value range: from 0 to 100
- Calculation: based on the ratio of average price gains to average price losses over a specified period. By default, this is 14 candles of the selected timeframe
Value Interpretation
- RSI > [value] — the asset is considered overbought, and the probability of a price decrease is higher. This is often used as a signal for a SHORT bot
- RSI < [value] — the asset is considered oversold, and the probability of a price increase is higher. This is often used as a signal for a LONG bot
How to Enable RSI on the Exchange Chart
- In the exchange terminal, click Indicators
- Type RSI in the search field
- Select Relative Strength Index
Indicator Settings on the Exchange
- Hover over the ⚙ icon next to the indicator name
- Set the period (Length). By default, it is 14 candles
- Important: use the same period value that you specify in the bot settings
Using RSI to Start a Bot
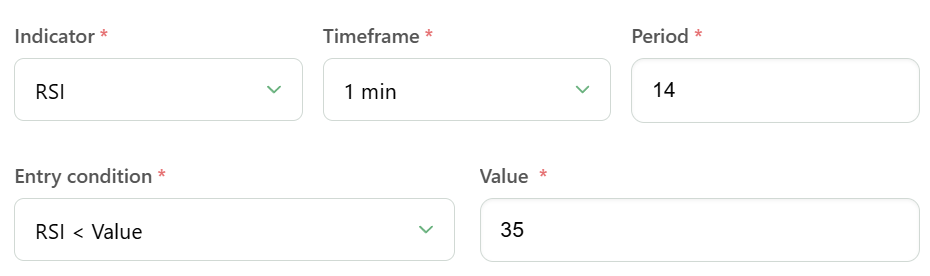
When configuring entry conditions, you define the RSI level yourself depending on your strategy.
- RSI > [value] — the bot will start if the indicator value rises above the specified level
- RSI < [value] — the bot will start if the indicator value falls below the specified level
Examples:
- RSI > 70 is often used as a signal to start a SHORT bot
- RSI < 30 can be used as a condition for a LONG bot