Bollinger
Bollinger Bands is a popular technical analysis indicator that helps evaluate market volatility and identify possible overbought or oversold zones.
Indicator Structure
- The middle line is a simple moving average (SMA) over the selected period
- Upper band = SMA + (standard deviation × multiplier)
- Lower band = SMA − (standard deviation × multiplier)
Standard deviation is a statistical measure that reflects how much values deviate from the average
How to Enable Bollinger Bands on the Exchange
- In the exchange terminal, click Indicators
- Type Bollinger Bands in the search field
Parameter Settings
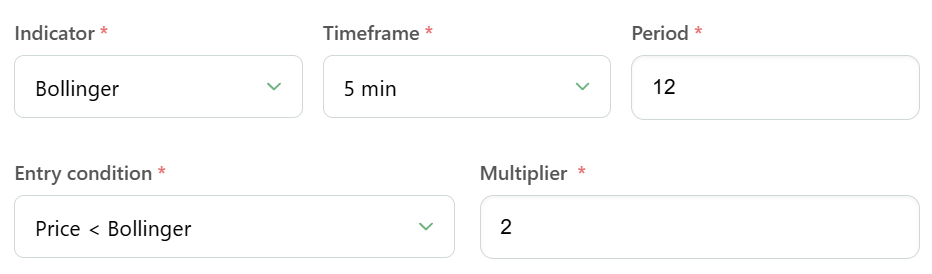
- Length — the number of candles used to calculate the SMA
- Mult — the standard deviation multiplier. In GinArea, the available range is from 1 to 3
- Important: use the same Length and Mult values in the exchange indicator as in the bot settings
Using in the Bot
- Price > Bollinger — the bot will start if the price moves above the upper band of the indicator
- Price < Bollinger — the bot will start if the price moves below the lower band of the indicator