Statistics Chart
Statistics open from the dropdown menu when you click the chart button, which is the rightmost icon in the row with the bot name.
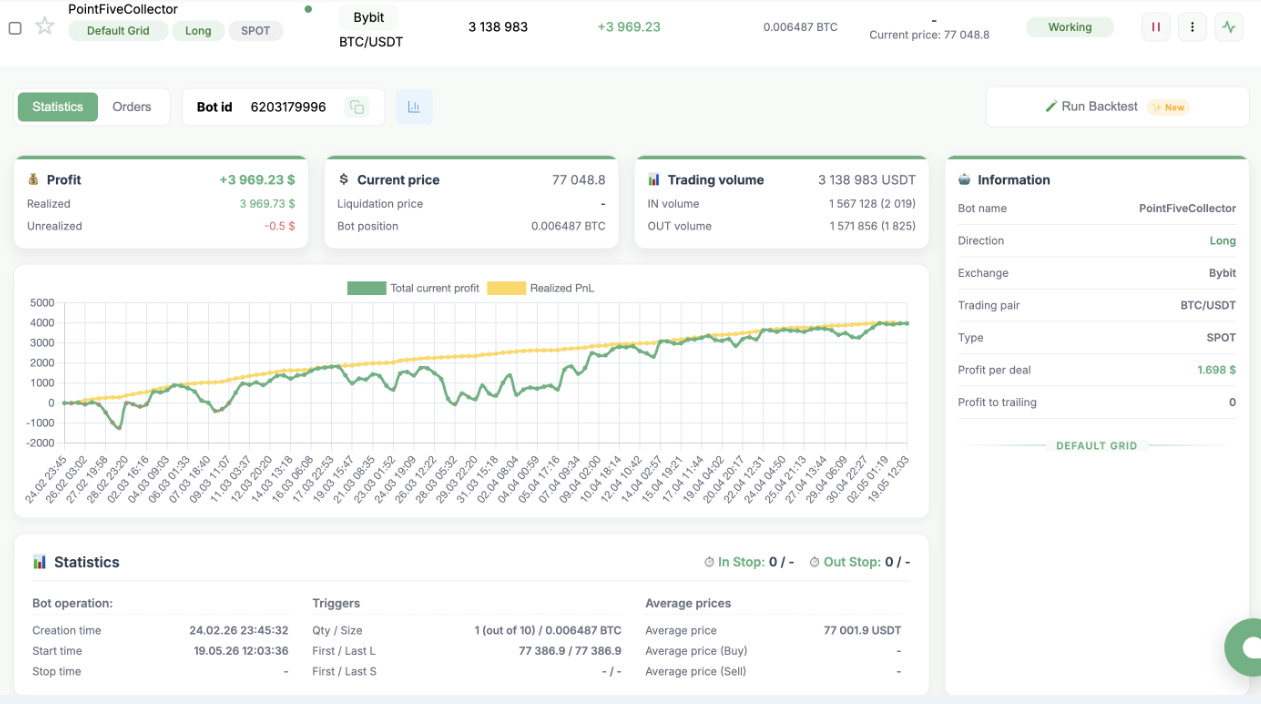
This is the main tool for getting accurate data on a running bot.
The chart visualizes the key indicators of the bot’s operation:
- Total Current Profit is displayed in green.
- Realized PNL is displayed in yellow.
These data help analyze the bot’s performance.
The chart updates periodically, so before closing a position, rely on the current data in the table. If the tab has been inactive for a long time, it is recommended to refresh the page to display the data correctly.
Profit
- Profit is the sum of Realized PNL and Unrealized PNL.
It matches the change in the exchange balance during the bot’s operation, excluding funding.
Profit is also used when Take-Profit and Stop-Loss are triggered. - Realized is the fixed profit from closed IN orders.
- Unrealized is the current profit or loss on the bot’s open orders. Do not confuse it with Unrealized P&L on the exchange.
Current Price
- Current price is the current asset price on the selected exchange.
- Liquidation price is pulled from the exchange and updated after each trade.
- Position is the bot’s position on the exchange.
If several bots are running on the same pair or you trade manually, the bot’s position and the exchange position may differ.
When using Auto Grid and Dynamic Grid, there may be a situation where there is no position, but the bot still has open triggers.
This means that Short and Long positions are equal, and when the price moves, the position may appear again, or it has been fully closed and will open again on the next fluctuation.
Trading Volume
- Trading volume is the total volume generated by the bot over its entire operation.
- IN volume is the total volume of opened IN orders and their number.
- OUT volume is the volume of closed Out Stop orders over the entire period and the number of closed orders.
This value may be lower than the number of opened orders because triggers are combined for closing during strong price movements.
In Stop / Out Stop
- In Stop is the number of orders collected when the In Stop parameter is active, and the price at which they will be opened.
- Out Stop is the number of triggered but not yet closed triggers and the price level at which these triggers will close IN orders and fix profit.
Time
- Creation time is the exact time when the bot was created.
- Start time shows the time of the first bot launch and is updated when the bot is launched again after being stopped.
- Stop time is the moment when the bot was stopped.
Triggers
- Qty / Size is the number of opened IN orders. The maximum value set during creation is shown in brackets. It also shows the position size opened by these orders.
- First / Last L is the nearest and farthest Long trigger.
- First / Last S is the nearest and farthest Short trigger.
Average Prices
- Average price is the average price of all unclosed IN orders.
- Average price (Buy) is the average price of all unclosed Long IN orders.
- Average price (Sell) is the average price of all unclosed Short IN orders.
Important: when contacting support, you must attach screenshots with the summary statistics and chart, as well as a screenshot of the bot settings. The bot settings are displayed when you check the box to the left of the bot name.